We took over Meta Ads management on October 12th. In our first week, we created three new campaigns (Consumer Sales Targeted, Consumer Sales Open, and B2B Leads) while optimizing the existing active campaigns. Here is a transparent look at where we stand, how the numbers break down, and our strategic plan to scale toward Bill's revenue targets.
Total Meta Spend
$5,607
Oct 12 – 19
Purchase Revenue
$9,134
12 purchases
Overall ROAS
1.63x
Account-wide
Website Leads
33
B2B + Consumer
Add to Cart
31
Purchase intent
Checkouts
40
Initiated
Key Takeaway: The account generated $9,134 in tracked purchase revenue on $5,607 in spend, delivering a 1.63x blended ROAS across all campaigns. Our new campaigns were only live for 4-5 days and are still in the Meta learning phase. The existing "Labour Sale" campaign has been the strongest performer at 2.33x ROAS.
Campaign-by-Campaign Performance
Every campaign broken down with spend, conversions, revenue, and ROAS so you can see exactly what each dollar produced.
Campaign
Status
Spend
Purchases
Revenue
ROAS
Leads
Labour Sale
Existing
$1,921.82
5
$4,485.51
2.33x
10
Test Audience VISO
Existing
$1,590.35
5
$2,135.00
1.34x
12
B2B Campaigns 01/22/26 - Copy
Existing
$831.69
1
$209.30
0.25x
7
VISO TOF 9 - Copy
Awareness
$810.53
0
$0
—
0
Consumer Sales [Targeted]
New
$168.17
1
$304.00
1.81x
0
Consumer Sales [Open]
New
$162.77
0
$0
—
6
B2B Leads Campaign
B2B Leads
$120.88
0
—
—
3
TOTAL
$5,607.14
12
$9,133.81
1.63x
33
What the Numbers Tell Us
Labour Sale (2.33x ROAS) is the top performer, driving $4,486 in revenue on $1,922 spend. This campaign has strong creative and audience traction.
Consumer Sales [Targeted] (1.81x ROAS) already generated a purchase in its first 4-5 days. This validates our new campaign structure and creative approach.
Consumer Sales [Open] generated 6 leads and 1 add-to-cart. Still in early learning but showing engagement signals.
B2B Leads Campaign captured 3 wholesale leads at $40.29 CPL. This is the wholesale/scheduling pipeline for higher-ticket B2B orders.
VISO TOF 9 - Copy ($811 spend, 0 purchases) is an awareness campaign feeding the top of funnel with 196K impressions. It does not directly produce purchases but fills the retargeting pool.
Meta vs. Google: Setting the Right Expectations
The expectation is for Meta to generate double the revenue of Google. However, the data shows this should be the other way around. Here is why, and how we should be measuring success for each platform.
Top of Funnel
Meta Ads
Awareness & Discovery. People see the VISO mask for the first time.
Purchase Intent. They search "VISO mask" or "Lumara" on Google and buy.
The Core Issue: Expecting Meta to produce 2x the revenue of Google reverses how these platforms actually work. Google historically averages ~5x ROAS because it captures high-intent buyers who are actively searching to purchase. Meta averages ~2x ROAS because it is creating awareness and demand at the top of funnel. When a customer sees a VISO mask ad on Instagram, they do not buy from the Instagram search bar. They go to Google, type "VISO mask," and purchase there. The sale gets credited to Google, but Meta created that customer. Google should naturally be the higher revenue channel.
What the Historical Data Proves
~5x
Google Ads Avg. ROAS High-intent search captures buyers who already know what they want. Google should be the higher revenue channel.
~2x
Meta Ads Avg. ROAS Discovery platform. Creates demand and feeds the Google funnel. Our target, which we are hitting.
33
Website Leads from Meta These leads enter the pipeline, get nurtured, and many convert later via Google or direct.
40
Checkouts Initiated 40 people started the checkout process from Meta ads. Not all completed, but this shows strong purchase intent.
Our approach: We are focused on optimizing Meta to be as efficient as possible at what it does best: creating demand, generating leads, and feeding the purchase funnel. We are hitting our 2x ROAS target. The goal is to continue optimizing for efficiency while scaling. Both channels work together: Meta creates the customers, Google closes them. The revenue expectation for each channel should match its role in the funnel.
Revenue Targets: Why the Numbers Should Be Flipped
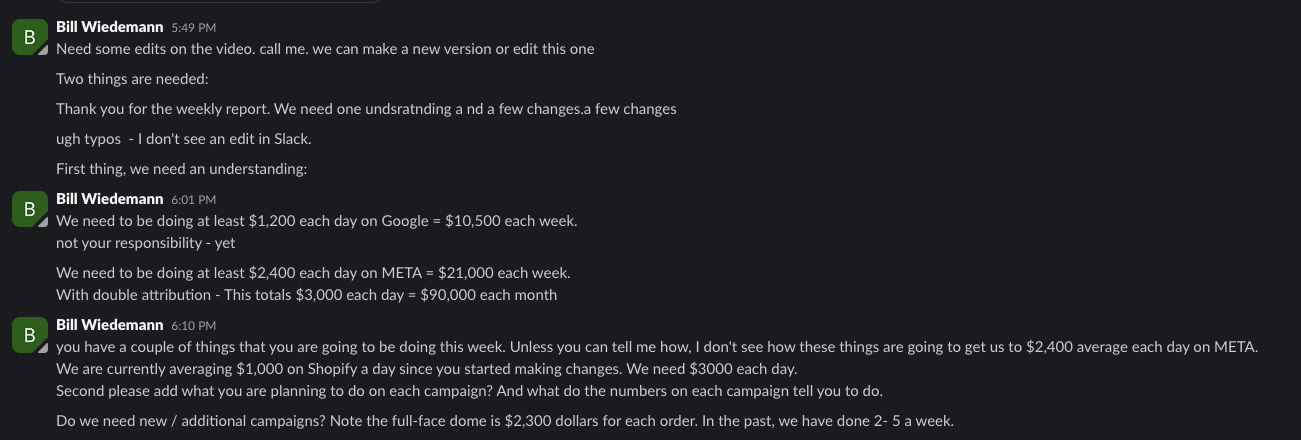
The current targets are $2,400/day in revenue from Meta and $1,200/day from Google. Based on the historical data and how these platforms actually perform, these numbers should be flipped.
Current Daily Pace (Oct 12-19)
Meta Daily Spend
$701
$5,607 / 8 days
Target Spend
$2,400
Per day
Meta Daily Revenue
$1,142
$9,134 / 8 days
Target Revenue
$3,000
Per day (Shopify total)
The Math: At Meta's historical ~2x ROAS, generating $2,400/day in revenue requires ~$1,200/day in spend. At Google's historical ~5x ROAS, generating $1,200/day in revenue only requires ~$240/day in spend. If we flip the targets to match what each platform actually delivers, Google at $240-$400/day in spend could realistically produce $1,200-$2,000+/day in revenue, while Meta at $1,200/day in spend produces $2,400/day. Expecting Meta (a 2x ROAS channel) to out-earn Google (a 5x ROAS channel) means Meta would need dramatically more budget for the same revenue output. Our focus is on making Meta as efficient as possible while scaling, to maximize total revenue across both channels.
Our 2x ROAS Goal: On Track
The initial target was 2x ROAS, and our top campaign is delivering 2.33x. The Labour Sale campaign alone produced $4,486 in revenue on $1,922 in spend. Our new Consumer Sales [Targeted] campaign is already at 1.81x in its first 4-5 days of learning. As campaigns exit the learning phase and we optimize creative, we expect blended ROAS to climb toward 2x+.
Realistic Revenue Expectations by Platform
Platform
Avg. ROAS
Current Target
Recommended Target
Why
Google Ads
~5x
$1,200/day revenue
$2,400/day revenue
High-intent search. People actively looking to buy. Should be the primary revenue driver.
Meta Ads
~2x
$2,400/day revenue
$1,200/day revenue
Discovery and demand creation. Feeds the Google funnel. Revenue expectation should match its role.
Bottom line: The combined revenue target of $3,600/day ($2,400 + $1,200) is achievable. But to get there efficiently, Google should carry the heavier revenue load because it converts at 5x, while Meta should carry the heavier spend load because it needs volume to create the demand that Google converts. Flipping the revenue expectations to match each platform's strengths is how we hit the combined target without wasting budget.
What We Built This Week
Consumer Sales Campaign [Targeted Audience]
Sales-optimized campaign with targeted audience based on interest and behavior signals. Multiple ad sets testing different creatives for the VISO mask. Already generated 1 purchase at 1.81x ROAS.
Consumer Sales Campaign [Open Audience]
Broad audience campaign letting Meta's algorithm find buyers. Testing creative angles. Generated 6 leads and 1 add-to-cart in early learning phase.
B2B Leads Campaign
Lead generation campaign targeting wholesale and B2B buyers. Captured 3 leads at $40.29 each. These leads convert to Schedule Demo and wholesale inquiries for the higher-ticket full-face dome ($2,300 per order).
Creative Design: VISO Mask Ad Sets
Designed and launched multiple creative variations across campaigns for A/B testing. Testing different angles, visuals, and messaging for the VISO mask product line.
What We Are Doing This Week (Oct 20-26)
Creating Pad Product Creative & Campaigns
Designing ad creatives for the pad product line. These are higher-ticket items and the next product down the line after masks. Will follow up with dedicated campaigns once creatives are finalized.
Scaling Winning Campaigns
Labour Sale (2.33x ROAS) and Consumer Sales [Targeted] (1.81x ROAS) will receive incremental budget increases of 20-30% to scale spend while maintaining performance.
Optimizing Underperformers
Evaluating VISO TOF 9 Copy ($811 spend, 0 direct purchases) and B2B Campaigns Copy (0.25x ROAS). Will restructure or reallocate budget to higher-performing campaigns.
New/Additional Campaign Evaluation
Assessing whether new campaign types (retargeting, lookalike audiences from purchasers, dynamic product ads) should be introduced to expand reach and improve overall efficiency.
The Full-Face Dome Opportunity
Bill noted that the full-face dome is $2,300 per order, with historical volume of 2-5 per week. This is a significant revenue lever.
$2,300
Per Dome Order High-ticket B2B product with strong margin.
2-5
Weekly Orders (Historical) $4,600 to $11,500 per week in dome revenue alone.
B2B Lead Pipeline: Our B2B Leads Campaign captured 3 leads in its first 4-5 days at $40.29 per lead. At $2,300 per dome order, even 1 conversion from these leads pays for weeks of lead generation spend. The Schedule and Lead conversions from this campaign directly feed the wholesale pipeline.
Scaling Roadmap: Maximizing Meta Efficiency
Our focus is disciplined scaling while maintaining the 2x+ ROAS target. We will increase budgets methodically on winning campaigns and expand the product line to open new revenue streams.
Scale winners (Labour Sale, Consumer Targeted) by 20-30%. Launch pad campaigns. Cut underperformers.
Phase 3
Nov 1-14
$1,500-$1,800/day
Pad campaigns generating. Introduce retargeting and lookalike audiences. Dynamic product ads.
Phase 4
Nov 15+
$2,000-$2,400/day
Full product coverage (masks + pads + dome B2B). Scale all proven campaigns. Maintain 2x+ ROAS.
Why gradual scaling matters: When you increase a Meta campaign's budget by more than 20-30% at a time, it resets the learning phase and Meta's algorithm has to re-learn who to show ads to. This causes temporary CPA spikes and wasted spend. By scaling methodically and launching new campaigns for new products (pads), we build multiple revenue streams simultaneously rather than over-loading a single campaign.
Shopify Revenue Context
Below is the Shopify data Bill referenced, showing $1,000/day average since changes were made. Our target is $3,000/day.
Important Context: Shopify revenue is influenced by both Meta and Google ads, organic traffic, email marketing, and direct visitors. Not all Shopify revenue is Meta-attributed. Our Meta campaigns generated $9,134 in tracked purchase revenue this week, but some of those purchases may have also been counted by Google's attribution when the customer later searched and completed checkout. Attribution overlap is normal in multi-channel advertising.